

Los Angeles City and County Tell Different Crime Stories
LAPD counted fewer offenses in all four surveyed categories. The county sheriff reported more robberies, even as its homicide count fell.

Campuses, Congress, the courts and the city police blotter: what the records say happened after the spring of 2024, and what it cost.
Nine months of police-recorded crime in four cities, each read against its own counting rules.
LAPD counted fewer offenses in all four surveyed categories. The county sheriff reported more robberies, even as its homicide count fell.

All four categories in the Philadelphia police comparison declined, though the size of the change varied sharply by offense.

The drop in robbery was substantially larger than the changes in homicide, reported rape or aggravated assault.
Two categories moved down and two moved up in the same nine-month police comparison.
January–September 2025 against the same months of 2026. Each bar is scaled to its own category.
Major Cities Chiefs Association, Nov. 12, 2026 · Preliminary counts

Compare the 2026 big-city survey with FBI national estimates and research on political violence.

Trace three years of recorded spending and which level of government was expected to pay.
Read what one federal case documented.

Three national surveys show a rising share of adults identifying as Muslim. The measurement tells us about religious identity, with limits on what can be inferred about migration or political views.
Encampment deals, congressional hearings, frozen grants and settlements, followed in the documents. All in-depth reports
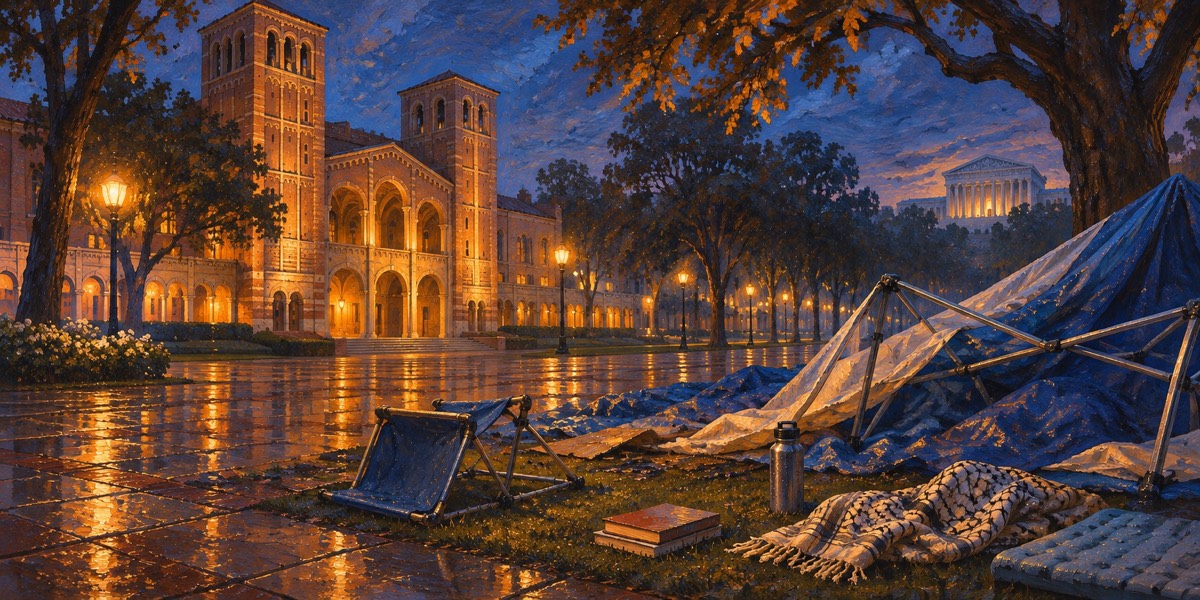
An independent review found that “no one from UCLA PD took command” when the encampment was attacked on April 30, 2024. Fifteen months later Washington cited the campus to freeze $584 million and seek a $1.2 billion payment. The courts have so far blocked most of it.

Fifteen months after agreeing to pay $221 million to settle federal claims, Columbia reports that no demonstration in the 2025–26 academic year led to a rules charge. The report also shows how far the university’s disciplinary machinery was rebuilt to get there.

The agreement that ended a five-day encampment in Evanston drew a congressional hearing, outlived the president who signed it and was finally canceled as a condition of restoring about $790 million in frozen federal research money.

The April 11, 2025 federal letter to Harvard listed changes to discipline, masks, student groups and academic programs. Harvard said no and went to court. Columbia, which settled, now reports compliance with many of the same items. Side by side, the two records show what was traded.
The House Education Committee’s antisemitism hearings of December 2023, April 2024 and May 2024 are remembered by a handful of clips. The official transcripts are longer and more ambiguous. Four of the seven university heads who testified were gone within two years.

Public universities are required to account for what they spend, and several published or released figures for the spring 2024 protests. Read closely, the numbers show where the money went: mostly to policing, not repairs. They also show how provisional many of the headline figures still are.

In the first week of May 2024, two public universities ended encampments with written agreements. Both refused to cut academic ties with Israel, and both promised reviews, committees and support for Palestinian students. The documents are short and specific, which makes them checkable. Most of the checking has not yet been done.

ACLED, the Crowd Counting Consortium and Princeton’s Bridging Divides Initiative each tracked the encampment wave. Their headline figures are often quoted side by side, but they count different things. This is a guide to what each number means, followed by what national polling says about the public’s view of the protests.
ACLED reported that the number of campus demonstrations it tracked rose by more than 36% in May 2024 compared with April. The demonstrations remained overwhelmingly peaceful, and reported incidents of violence at them declined month to month.
Individual campuses documented specific disruptions. At Columbia University, an April 30 advisory asked people who could stay away from the Morningside campus to do so after protesters occupied Hamilton Hall. The university reported restricting access that day.
On April 30, 2024, Brown agreed to bring a student divestment proposal to its governing corporation in October. In exchange, student organizers agreed to end their encampment. The agreement also gave students a chance to present their case to members of the corporation.
On October 8, the corporation accepted its advisory committee’s recommendation against divesting from the 10 companies named in the proposal. The agreement secured a formal decision. The board rejected the requested investment change.
In February 2024, 38% of U.S. adults ages 18–29 said Israel had valid reasons for fighting Hamas, compared with 78% of adults ages 65 and older. Those figures describe answers to a question about Israel’s reasons for fighting. Pew asked separately whether Israel’s conduct in the war was acceptable.
The age gap provides a baseline for studying public opinion. Identifying any effect of activism would require evidence of exposure to protests or campaigns and a research design that accounts for other influences.
Pew Research Center’s survey findings20 reports on hospitals, casinos, telecoms, retailers and manufacturers, from the breach to the court filings. All 60 reports



















Headlines from AP, Courthouse News, CSIS, Pew, Religion News Service and the GW Program on Extremism, updated automatically. Links open the original publisher. Full monitor
Individual prosecutions and police counts, city by city.
Citywide robberies fell in 2025 as recorded rape rose.
A federal case documented arson, looting and property damage during August 2020 unrest.
A pawnshop moved stolen merchandise from local retailers across state lines.
A jury convicted a man after two churches burned on Church Square.
What the reviewed sources establish, and where the record is silent. An evidence gap is not a reported zero.
A US historical study compares incarceration by birthplace from 1870 to 2020. It finds lower incarceration rates for immigrants in recent decades. Incarceration is the outcome measured and the comparison uses birthplace. It does not estimate protest involvement, incidents committed, or outcomes by religious affiliation. NBER research paper
Cost figures retain their original geography and reporting period. An evidence gap here is not a reported zero.
Evidence review · November 15, 2026. The latest records are linked in the table.
| Area | What the sources establish |
|---|---|
| Policing and dispersal | The case sources reviewed here do not establish a spending total for protest policing, overtime or dispersal. Englewood’s city manager told The Record that the city had incurred $32,000 in overtime since October 7, most of it for additional police at council meetings and protests. The figure reported in 2024 covers several activities. No breakdown in the account assigns an amount to any one demonstration. Teaneck’s separate municipal budget reports police spending by account, which cannot establish the protest share of its spending. Interview with the Englewood city manager · Teaneck municipal budget book |
| Property damage and repairs | No verified repair bill attributable to these protests appears in the sources reviewed for this profile. |
| Businesses and economic activity | The coverage does not establish lost sales, insured losses or a nationwide business impact. |
| Transport and access | The San Francisco district attorney said the April 15, 2024 Golden Gate Bridge protest left hundreds of motorists on the bridge and US 101 for several hours. The office did not publish a dollar estimate for the delays. District attorney’s release |
52,375,047 international migrants lived in United States at midyear 2024, according to UN DESA estimates. This is the resident migrant stock. The UN uses birthplace or citizenship depending on the source available for each country. UN DESA definitions · Country figures
Both bars use a 0–100% scale. Estimates describe the whole population. Pew Research Center dataset
These population measures have different denominators and dates. Neither identifies participants in a demonstration, and aggregating their counts cannot establish which people caused a disruption.